 MORPHO
1. Open your design population
Connect the same Directory used to save the study to the Visualizer component and set Show to true. The viewer connects to the local project and refreshes as saved results change. Set Show to false to close it.
Rhino 8 on Windows with modern .NET uses an embedded viewer. Rhino 7, macOS, and Rhino 8 in .NET Framework mode open the default browser. Keep the Morpho Visualizer host window open while using the browser so the local project connection stays available.
Two different kinds of filtering: Visualizer filters narrow what you see. Gene Generator fitness filters choose parents for future solutions. Reviewing a filtered gallery does not, by itself, update the generation rule in Grasshopper.
2. Image-based comparison
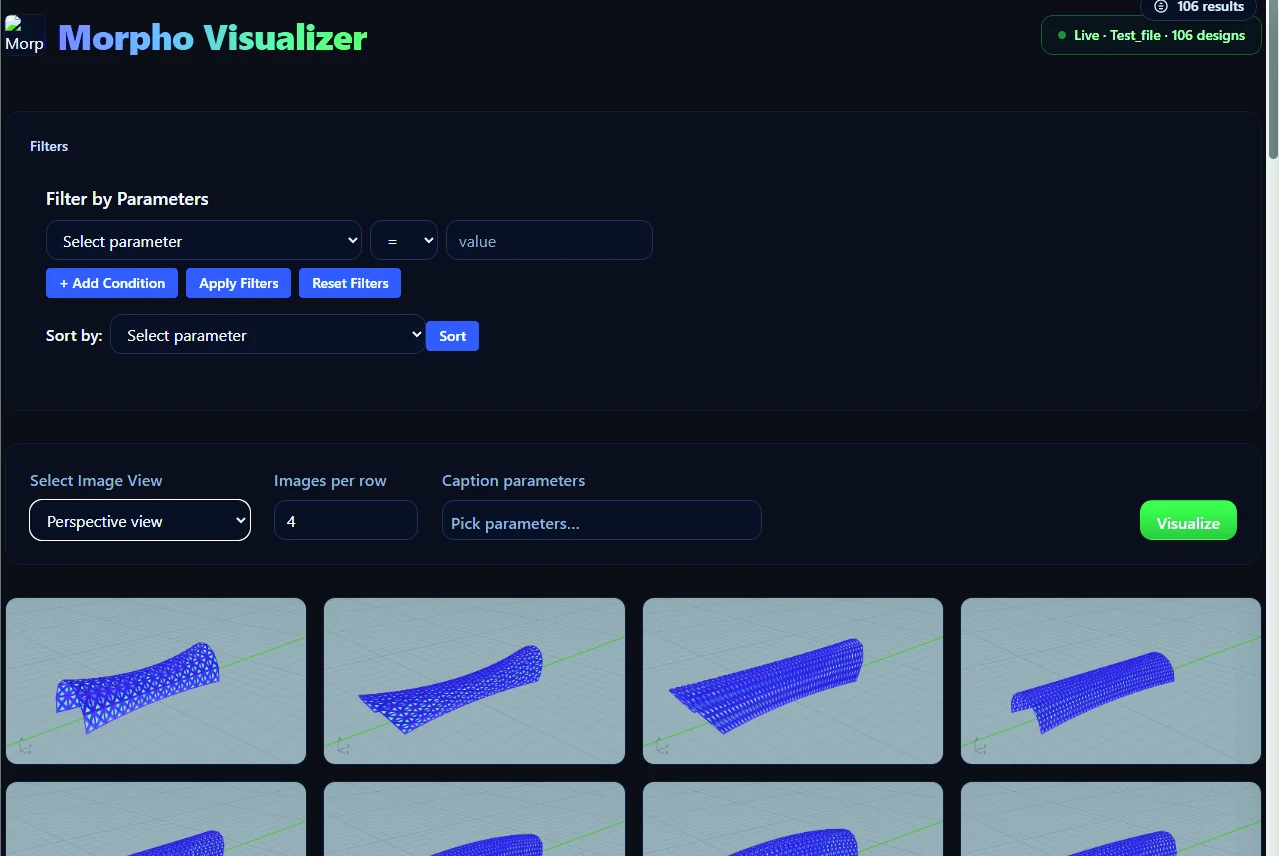
The gallery displays images of saved alternatives alongside their solution IDs and chosen numerical captions. Choose an image view—such as isometric, top or an analysis image—from the views available in your project.
- Select Image View: switch between captured image folders.
- Images per row: adjust gallery density to scan many alternatives or inspect larger images.
- Caption parameters: choose which recorded values appear with each image.
- Solution details: open an alternative to inspect its numerical values and available images.
- Image inspection: open an image in a separate tab for a closer look.
3. Narrow and organize the view
Add a numerical condition by choosing a parameter, an operator and a value, then apply the filters. Add further conditions to focus on alternatives satisfying your criteria. Reset Filters returns to the broader view. A no-match message helps you see when the current conditions exclude every alternative.
Use Sort by to order the alternatives by a recorded parameter. Combine ordering with image captions to examine how form changes across a numerical range. The displayed results remain a view of your stored study; filtering the gallery does not delete database records.
After identifying useful alternatives, note their actual solution IDs and return to Filter ID or Filter Expression in Grasshopper to guide the next generation.
4. Two- and three-dimensional scatter plots
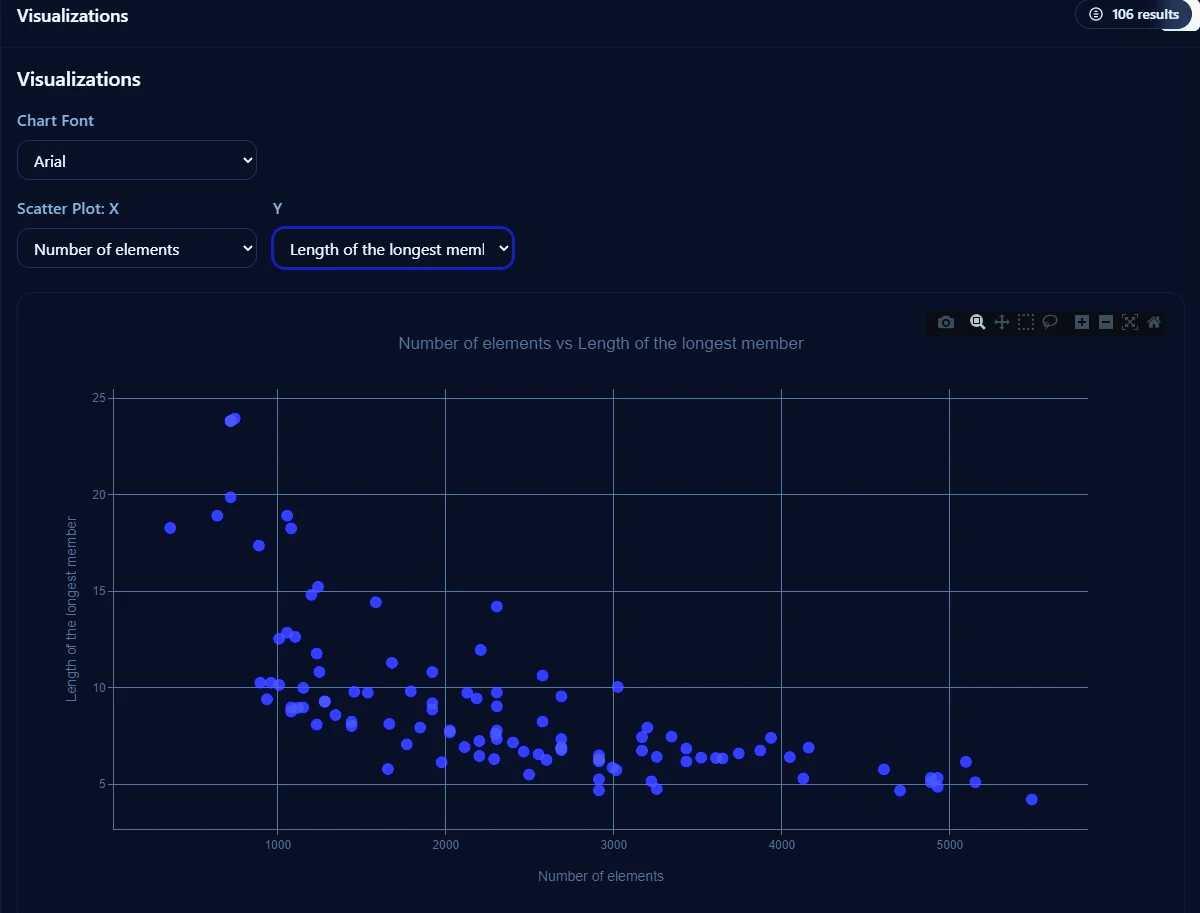
2D scatter plots
Choose an X parameter and a Y parameter to plot the alternatives. Inspect clusters, trends and compromises between two recorded quantities. Hover a point to see its ID and values; select a point to open the corresponding design details.
3D scatter plots
Choose X, Y and Z parameters to investigate three variables together. Rotate the plot to inspect the distribution from different angles, then select a point to connect its values back to the individual design. This can expose relationships that overlap in a two-dimensional projection.
Read trade-offs with care
A lower value can be desirable for one metric and undesirable for another. Define the objective directions before interpreting a plot. Correlation can suggest a relationship worth investigating; it does not establish causation or prove that a design is suitable.
5. Parallel coordinates
Parallel coordinates represent each selected parameter as an axis and each alternative as a line crossing those axes. Choose two or more parameters, search the parameter list, and choose a parameter for color encoding.
Brush ranges on the axes to focus on a portion of the design space. If brushing narrows the result to a single line, the viewer can open that alternative’s details. With many selected axes, scroll horizontally to examine the whole chart.
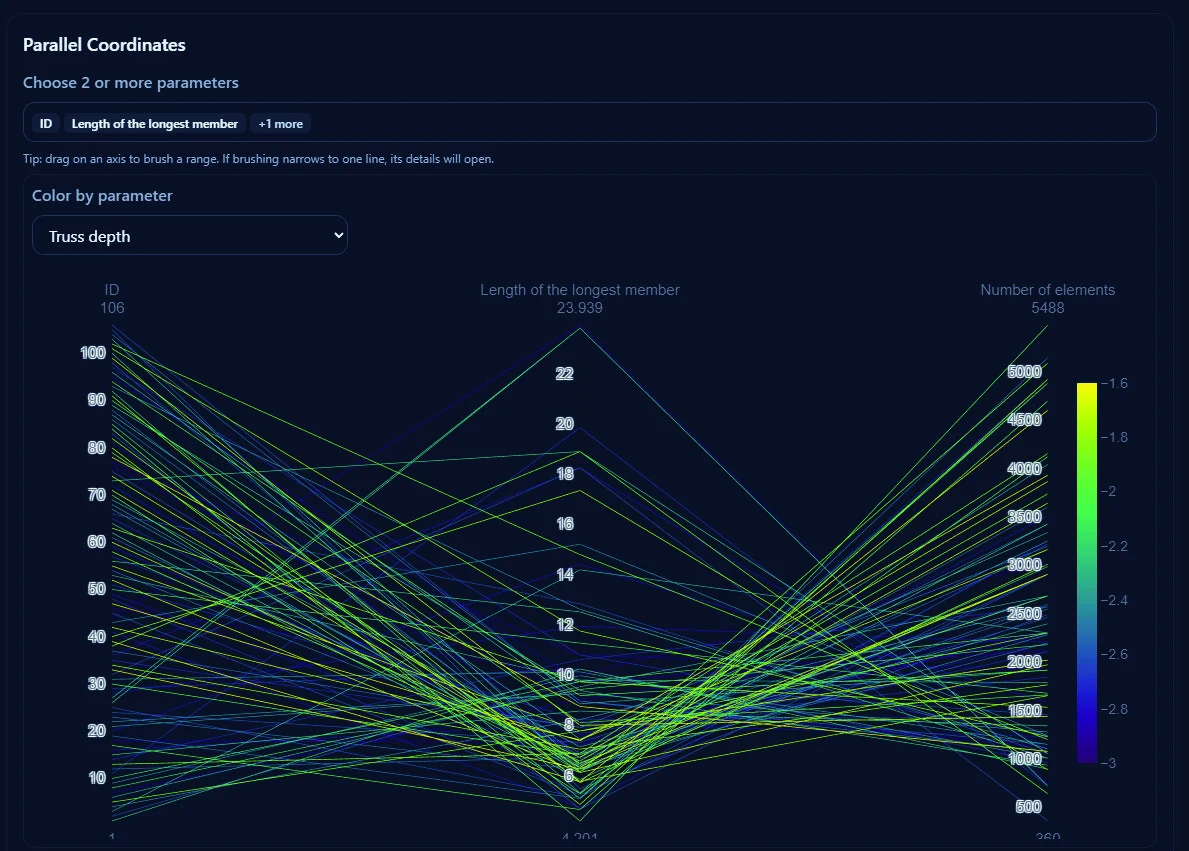
Use this view to look for conflicts across objectives, patterns shared by a subset, or alternatives with a distinctive combination of characteristics. Keep the image gallery available to judge the spatial qualities behind those lines.
6. Dataset import and figure export
Upload a dataset
The viewer also provides a local upload workflow for a CSV and image folders. Choose the CSV, optionally identify its ID column, add image folders, and parse the dataset. Additional image folders can be added in the upload form.
Check the resulting ID and image associations before drawing conclusions. Uploaded image matching uses row order; confirm that each folder follows the CSV’s order. Supplying an ID column does not remove the need to verify those associations. The connected project workflow already links its media to project records.
Export charts
Use the plot toolbar’s image-download control where available to save charts for reports and presentations. The 2D scatter plot supports PNG export, and the 3D plot includes a dedicated PNG download action. Use the chart-font selector to choose a presentation font. For further numerical analysis, use the project’s generated CSV.
Save a note of the filter conditions, plotted parameters and objective directions alongside exported figures so the comparison remains understandable later.
7. Pareto fronts: the idea and the current viewer
The manual discusses Pareto-optimal, or non-dominated, alternatives. For a chosen set of objectives and their directions, a solution is non-dominated if no other solution is at least as good in all of them and strictly better in at least one.
This is a useful way to reason about trade-offs, but the currently bundled 2.1 viewer does not expose an automatic Pareto-front calculation or highlight control. Its scatter plots help you inspect the population; an exact non-dominated set requires a separate analysis of the saved values.
A result that is non-dominated for two objectives may cease to be non-dominated when the objective set or directions change. Use the manual’s discussion as a decision-making concept rather than assuming that every visible plot marks an automatically computed front.