 MORPHO
1. Introduction
Computational design exploration involves more than the evaluation of a single optimum. A design question may include measurable objectives, competing constraints and spatial or visual qualities that are difficult to reduce to a numerical expression. An exploration environment must therefore support both the production of alternatives and their interpretation.
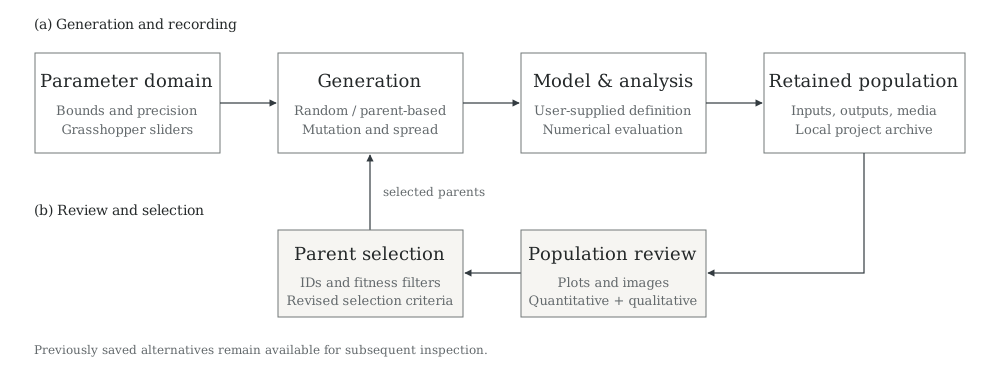
Morpho addresses this task through a recorded population of designs. Parameter values generate alternatives in a Grasshopper definition; analysis outputs and images describe those alternatives; the designer then identifies parents or numerical conditions for further generation. The archive remains available as the direction of inquiry changes.
The approach relates to work on genetic algorithms and the Theory of Inventive Problem Solving (TRIZ) in conceptual design [1]. The manual describes the software’s population model as a Non-Destructive Dynamic Population Genetic Algorithm (NDDP-GA) [2]. The software’s operational scope is specified separately from that broader research context.
2. Representation of the design space
Let a design be represented by a vector of input parameters x. In the current implementation, Grasshopper number sliders specify the name, bounds and precision of each input. The parametric definition determines the geometric family that can be expressed.
Notation is explanatory. The realized set is also constrained by slider precision, integer steps and the geometry encoded in the definition.
| Symbol | Interpretation | Software correspondence |
|---|---|---|
| x | Design input vector | Genes generated from the connected sliders |
| y | Recorded numerical outputs | Named values supplied to Data Aggregator |
| m | Associated media | Tagged images and optional textual files |
| 𝒫 | Saved design population | Project records in the local database |
| 𝒮 | Eligible parents | IDs selected by the connected fitness filters |
The analysis model supplies the numerical outcomes. Morpho does not contain a structural, daylight or environmental simulation solver. The validity and units of an output must be established through the model and evaluation tools used in the study.
3. Exploration procedure
The process alternates between generation, recording and review. With no fitness filter, the generator samples new parameter values within the input bounds. When eligible saved parents are selected, their values inform new combinations; mutation and spread settings control aspects of that variation.
- Define the design variables and verify the evaluation model.
- Generate an initial sample without a fitness filter.
- Record input values, numerical outputs and relevant images.
- Review the saved population using images and numerical representations.
- Select eligible parents by solution ID, numerical criteria or a combined expression.
- Generate additional alternatives and append their records to the population.
- Reassess the selection criteria and document the reasons for continuation or termination.
3.1. Population retention
Non-destructive exploration keeps previously saved alternatives available for review. Conceptually, a completed save adds a record containing an ID, input values, recorded outputs and associated media:
A conceptual description of successful record accumulation, not a guarantee against external modification or data loss. Back up the complete project folder.
3.2. Parent selection
Selection may express numerical conditions, direct inspection of design images, or both. Filter ID identifies specific saved alternatives; Filter and Filter Expression apply named comparisons and rankings. A selected set is local to the connected project.
ID IN (46, 73) AND Weight < 40000Illustrative expression. The IDs, parameter name and threshold above are examples, not a recommendation or a reported experimental result. A valid selection with no matching records falls back to random generation; invalid expressions stop generation and report an error.
See the expression-language reference for precedence, ranking behavior and treatment of missing values.
4. Observation and interpretation
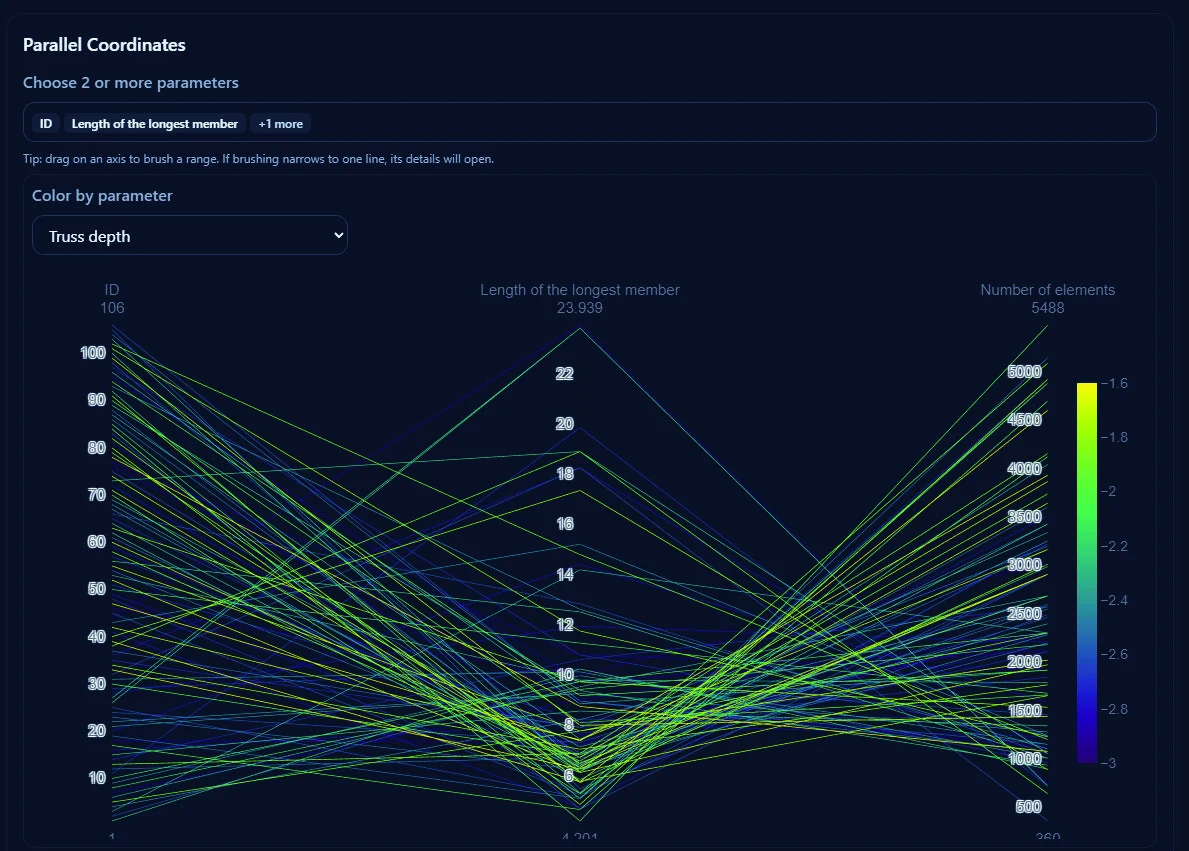
Each representation supports a different question. The image gallery relates visual form to recorded values; scatter plots reveal distributions across two or three parameters; parallel coordinates support the comparison of multiple dimensions. Their interpretation depends on objective directions, units and analysis assumptions.
4.1. Quantitative and qualitative assessment
A numerical filter makes a selection rule explicit, but does not by itself establish design quality. Visual inspection may identify proportion, spatial character or other concerns absent from the recorded metrics. The rationale for both kinds of selection should accompany the record of a study.
4.2. Non-dominated alternatives
A solution is non-dominated for a specified objective set when no other solution is at least as good in every objective and strictly better in at least one. This concept is discussed in the manual. The current bundled viewer does not provide automatic Pareto-front extraction or highlighting; an exact non-dominated set requires separate analysis of the saved values.
Changing the objective set or its directions can change which alternatives are non-dominated. A visually promising region of a scatter plot should not be presented as a calculated Pareto front unless that calculation has actually been performed.
5. Implementation and documentation
Morpho 2.1 provides seven core components for generation, capture, storage and visualization, and nine components for fitness selection and logical composition. The following documents describe the implemented behavior.
| Document | Coverage |
|---|---|
| I. Methodology | Research context, population model, application domains and project credits |
| II. Component specification | All 16 active interfaces, filter syntax and selection semantics |
| III. Visual analysis | Gallery, plots, parameter filters, import and export behavior |
| IV. Implementation protocol | Installation, model connections, execution and data management |
| V. Study protocol | Research questions, assumptions, run records and reporting requirements |
| VI. Materials & references | Software, original manual, references and BibTeX records |
6. Scope and limitations
- Representation. Exploration is restricted to the family of designs expressible by the supplied parametric definition.
- Evaluation. Recorded outputs inherit the assumptions, uncertainties and errors of the analysis model.
- Selection. Numerical rankings describe the current recorded population and the selected criteria; they do not guarantee global optimality.
- Research concepts. The current software contains neither an automated TRIZ problem-solving engine nor automatic Pareto-front extraction.
- Repeatability. Random generation and external dependencies can affect repeated runs. Preserve the actual population and settings; do not assume deterministic replay.
The study protocol specifies a practical record for making these assumptions visible and distinguishing saved observations from their interpretation.
7. Acknowledgments
Morpho is led by Anahita Khodadadi, with development support from the University at Buffalo Research Foundation. The manual acknowledges Krishna Sivakumar, Jagruthi Kelavalli Jagadish and Babak Askari for computational development; Ryan Mellen for initial documentation and formatting; and Kimia Ghaderian for the logo. Further project background and contact information appear in the contributor record.
8. References
- [1]Khodadadi, A., and von Buelow, P. (2022). Design exploration by using a genetic algorithm and the Theory of Inventive Problem Solving (TRIZ). Automation in Construction, 141, 104354. doi:10.1016/j.autcon.2022.104354.
- [2]Khodadadi, A. (2026). Morpho 2.0 User Manual. First edition, October 2026. 35 pp. Full text [PDF]. doi:10.5281/zenodo.23477542.
The manual’s published title is retained. Software distributed on this website is version 2.1.0. Download bibliographic records [BibTeX].